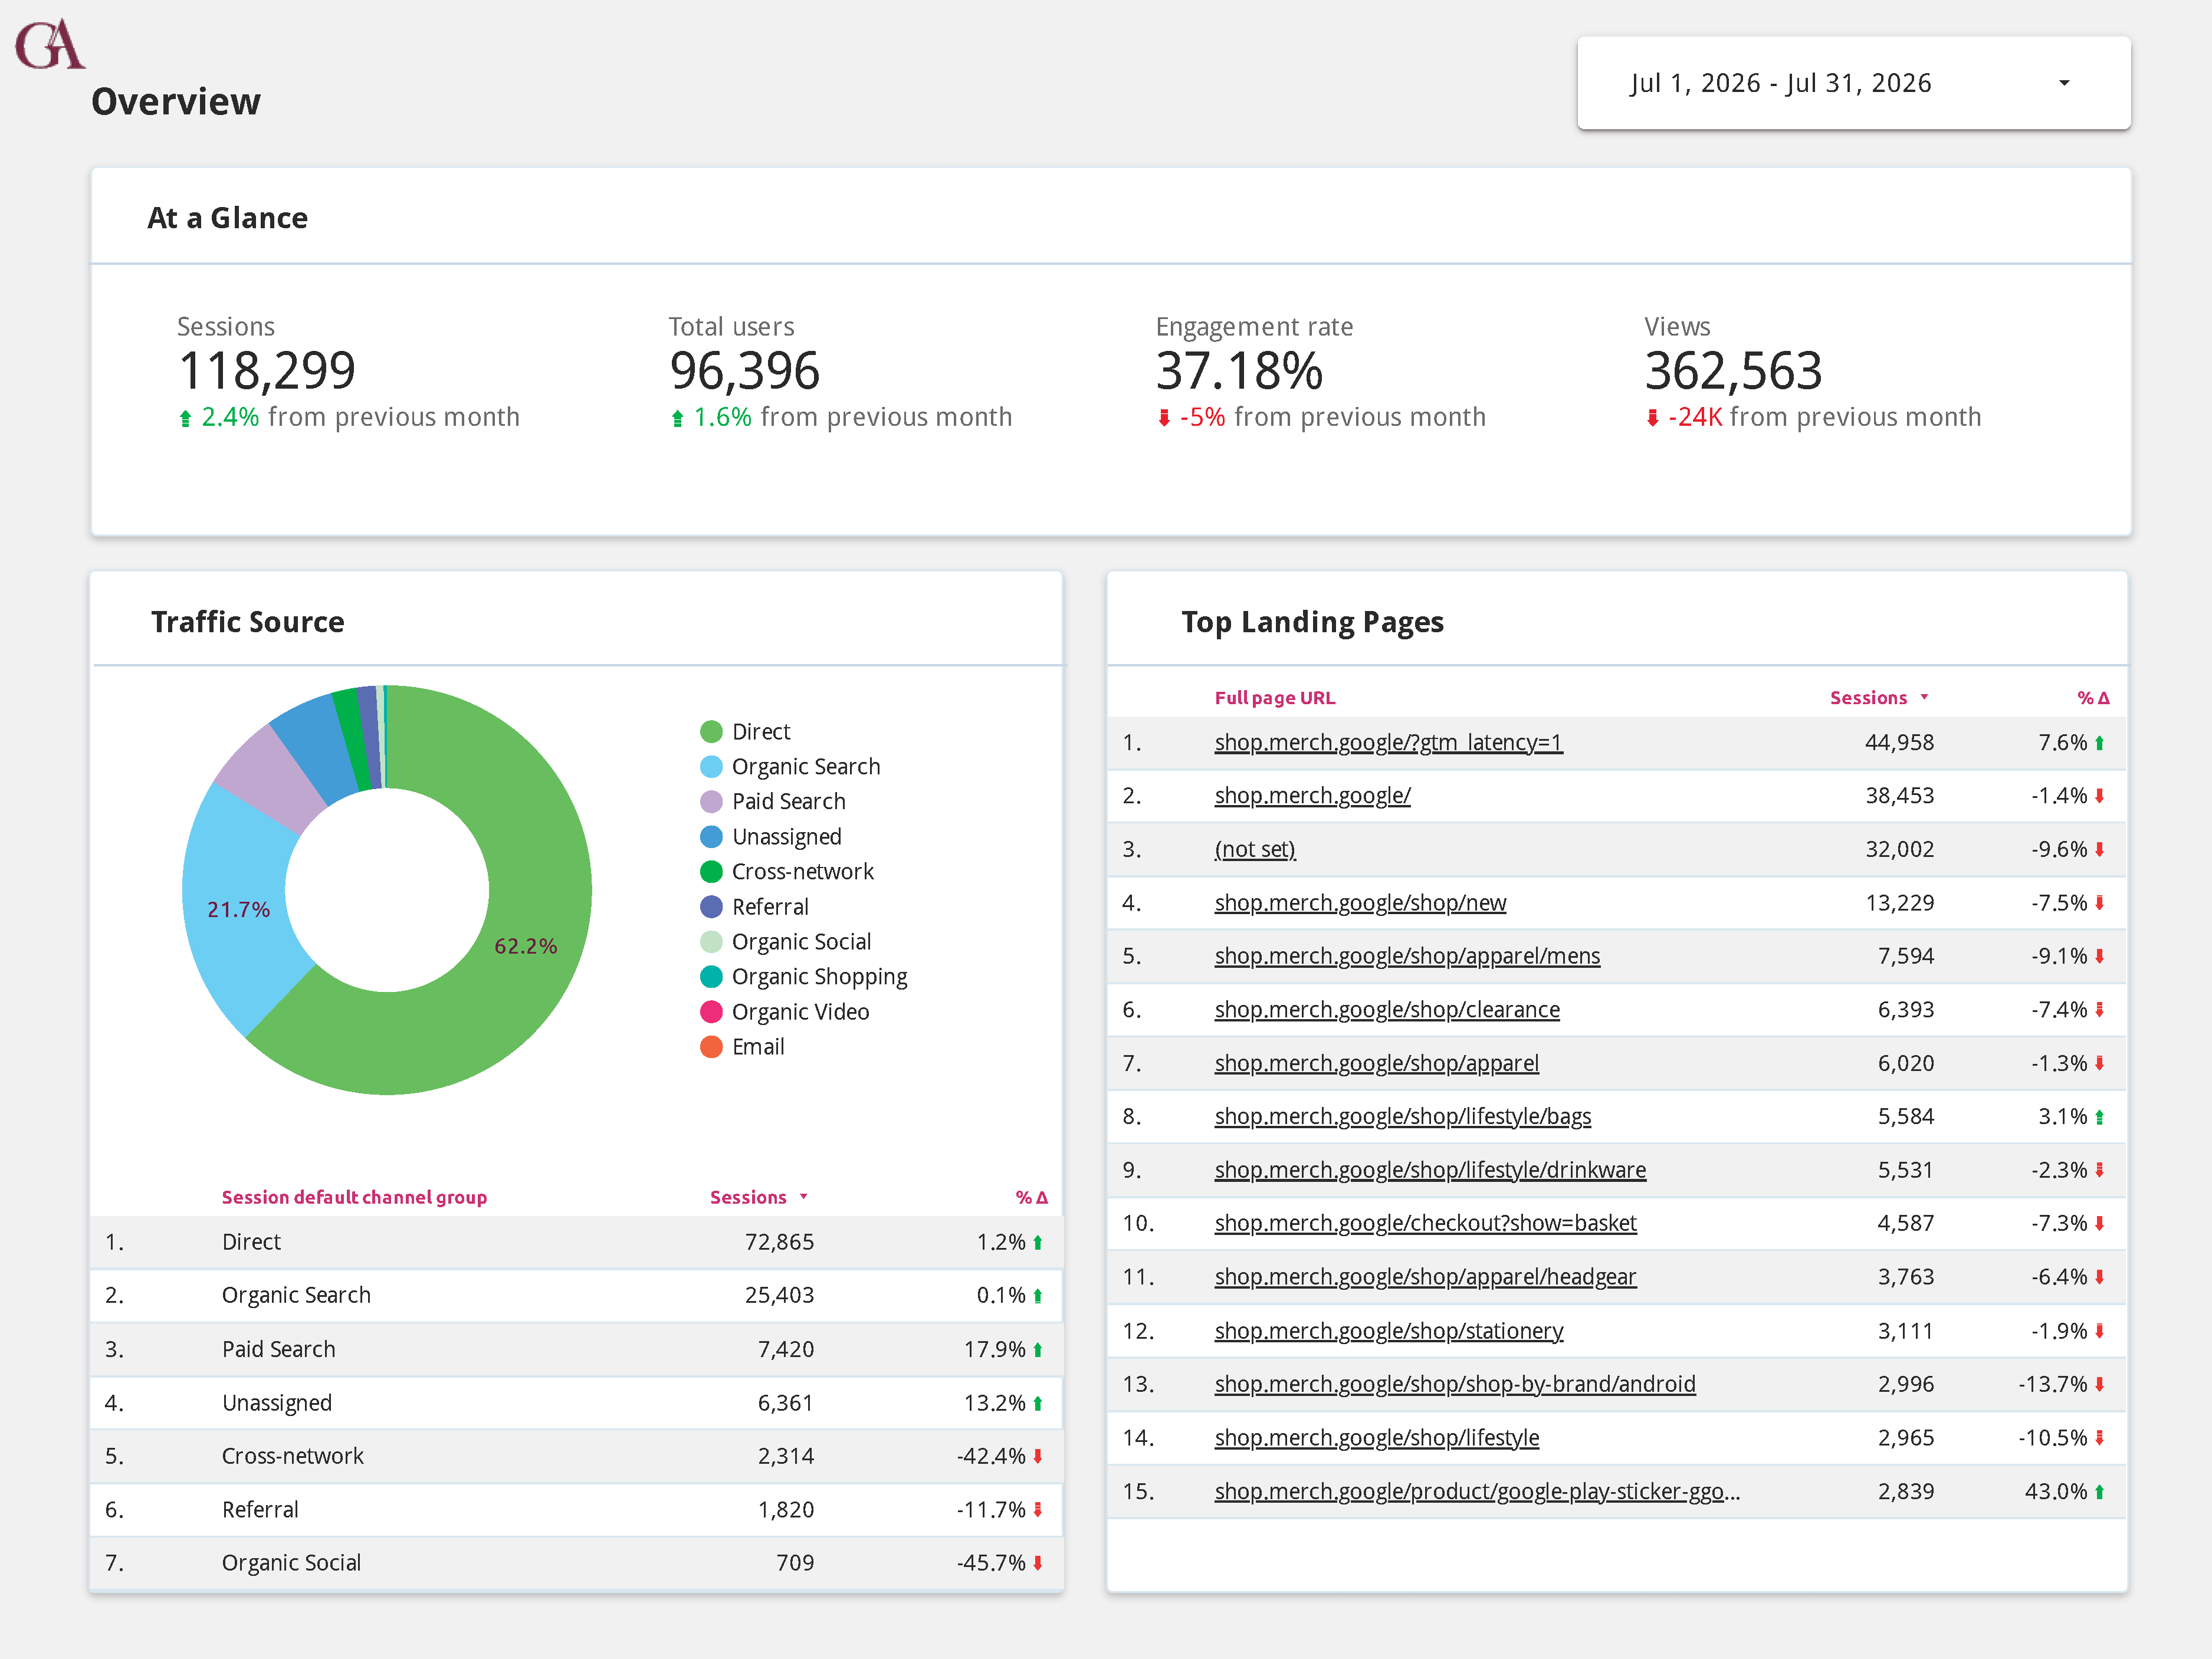
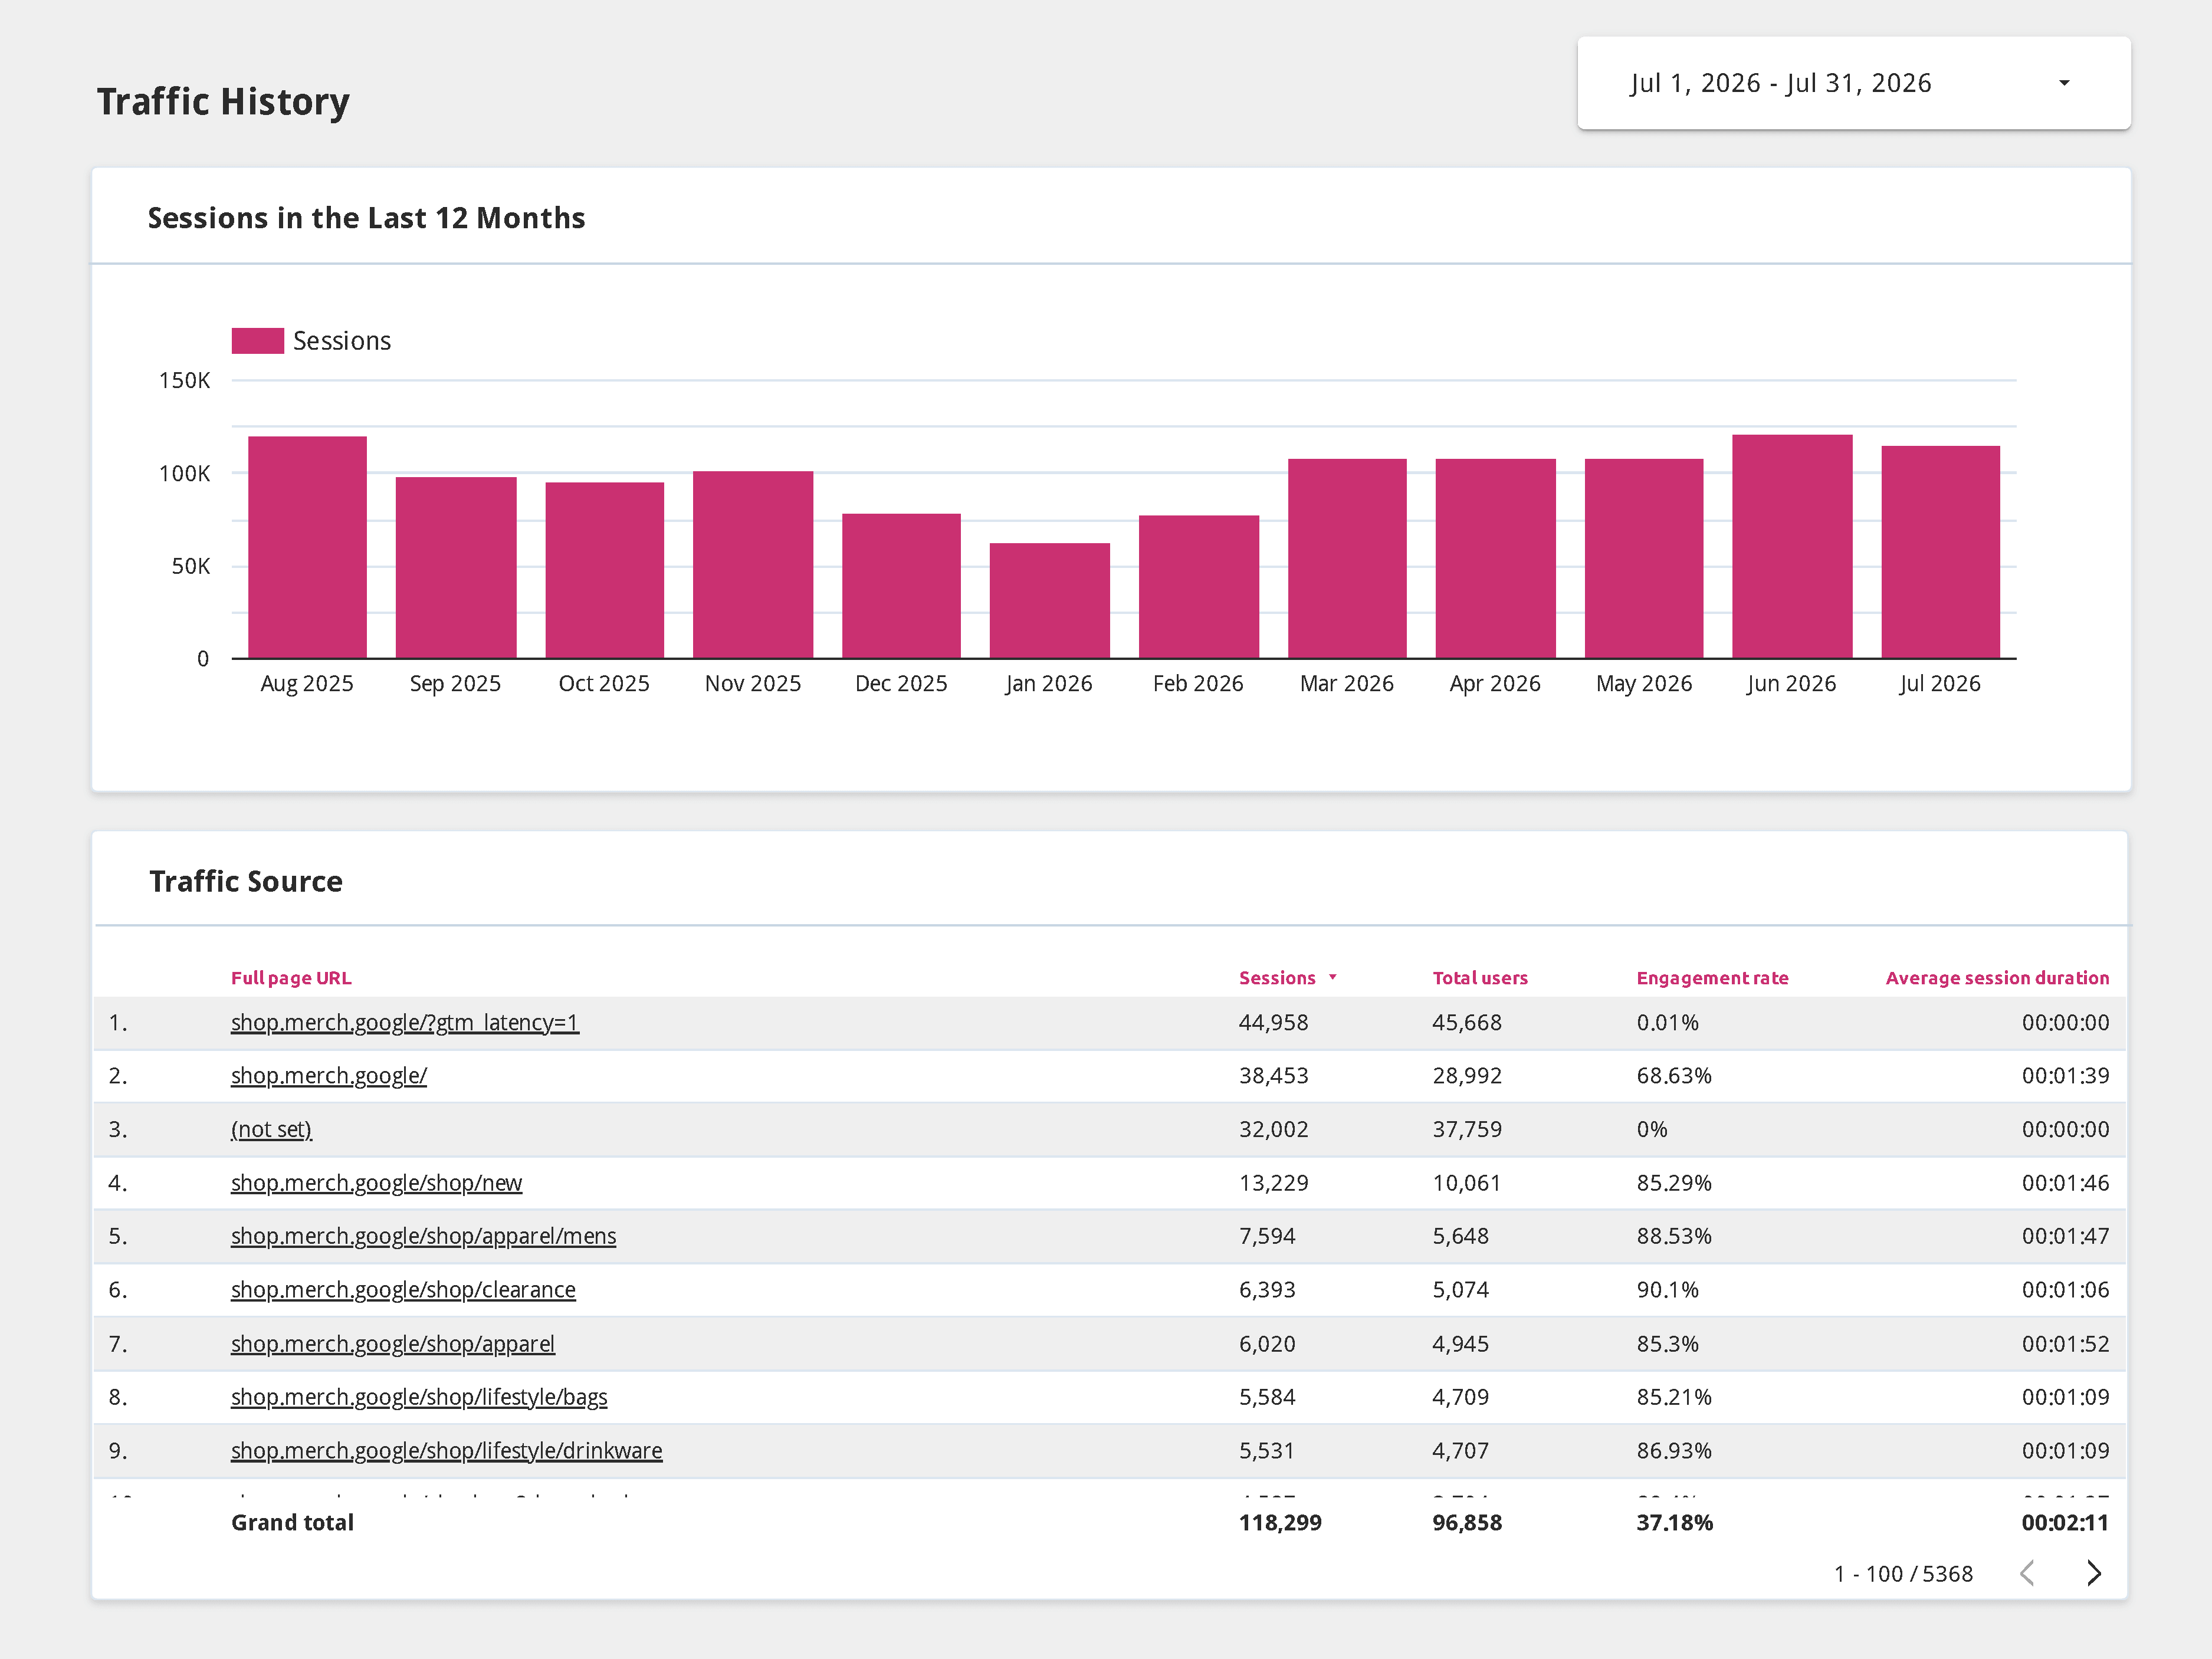
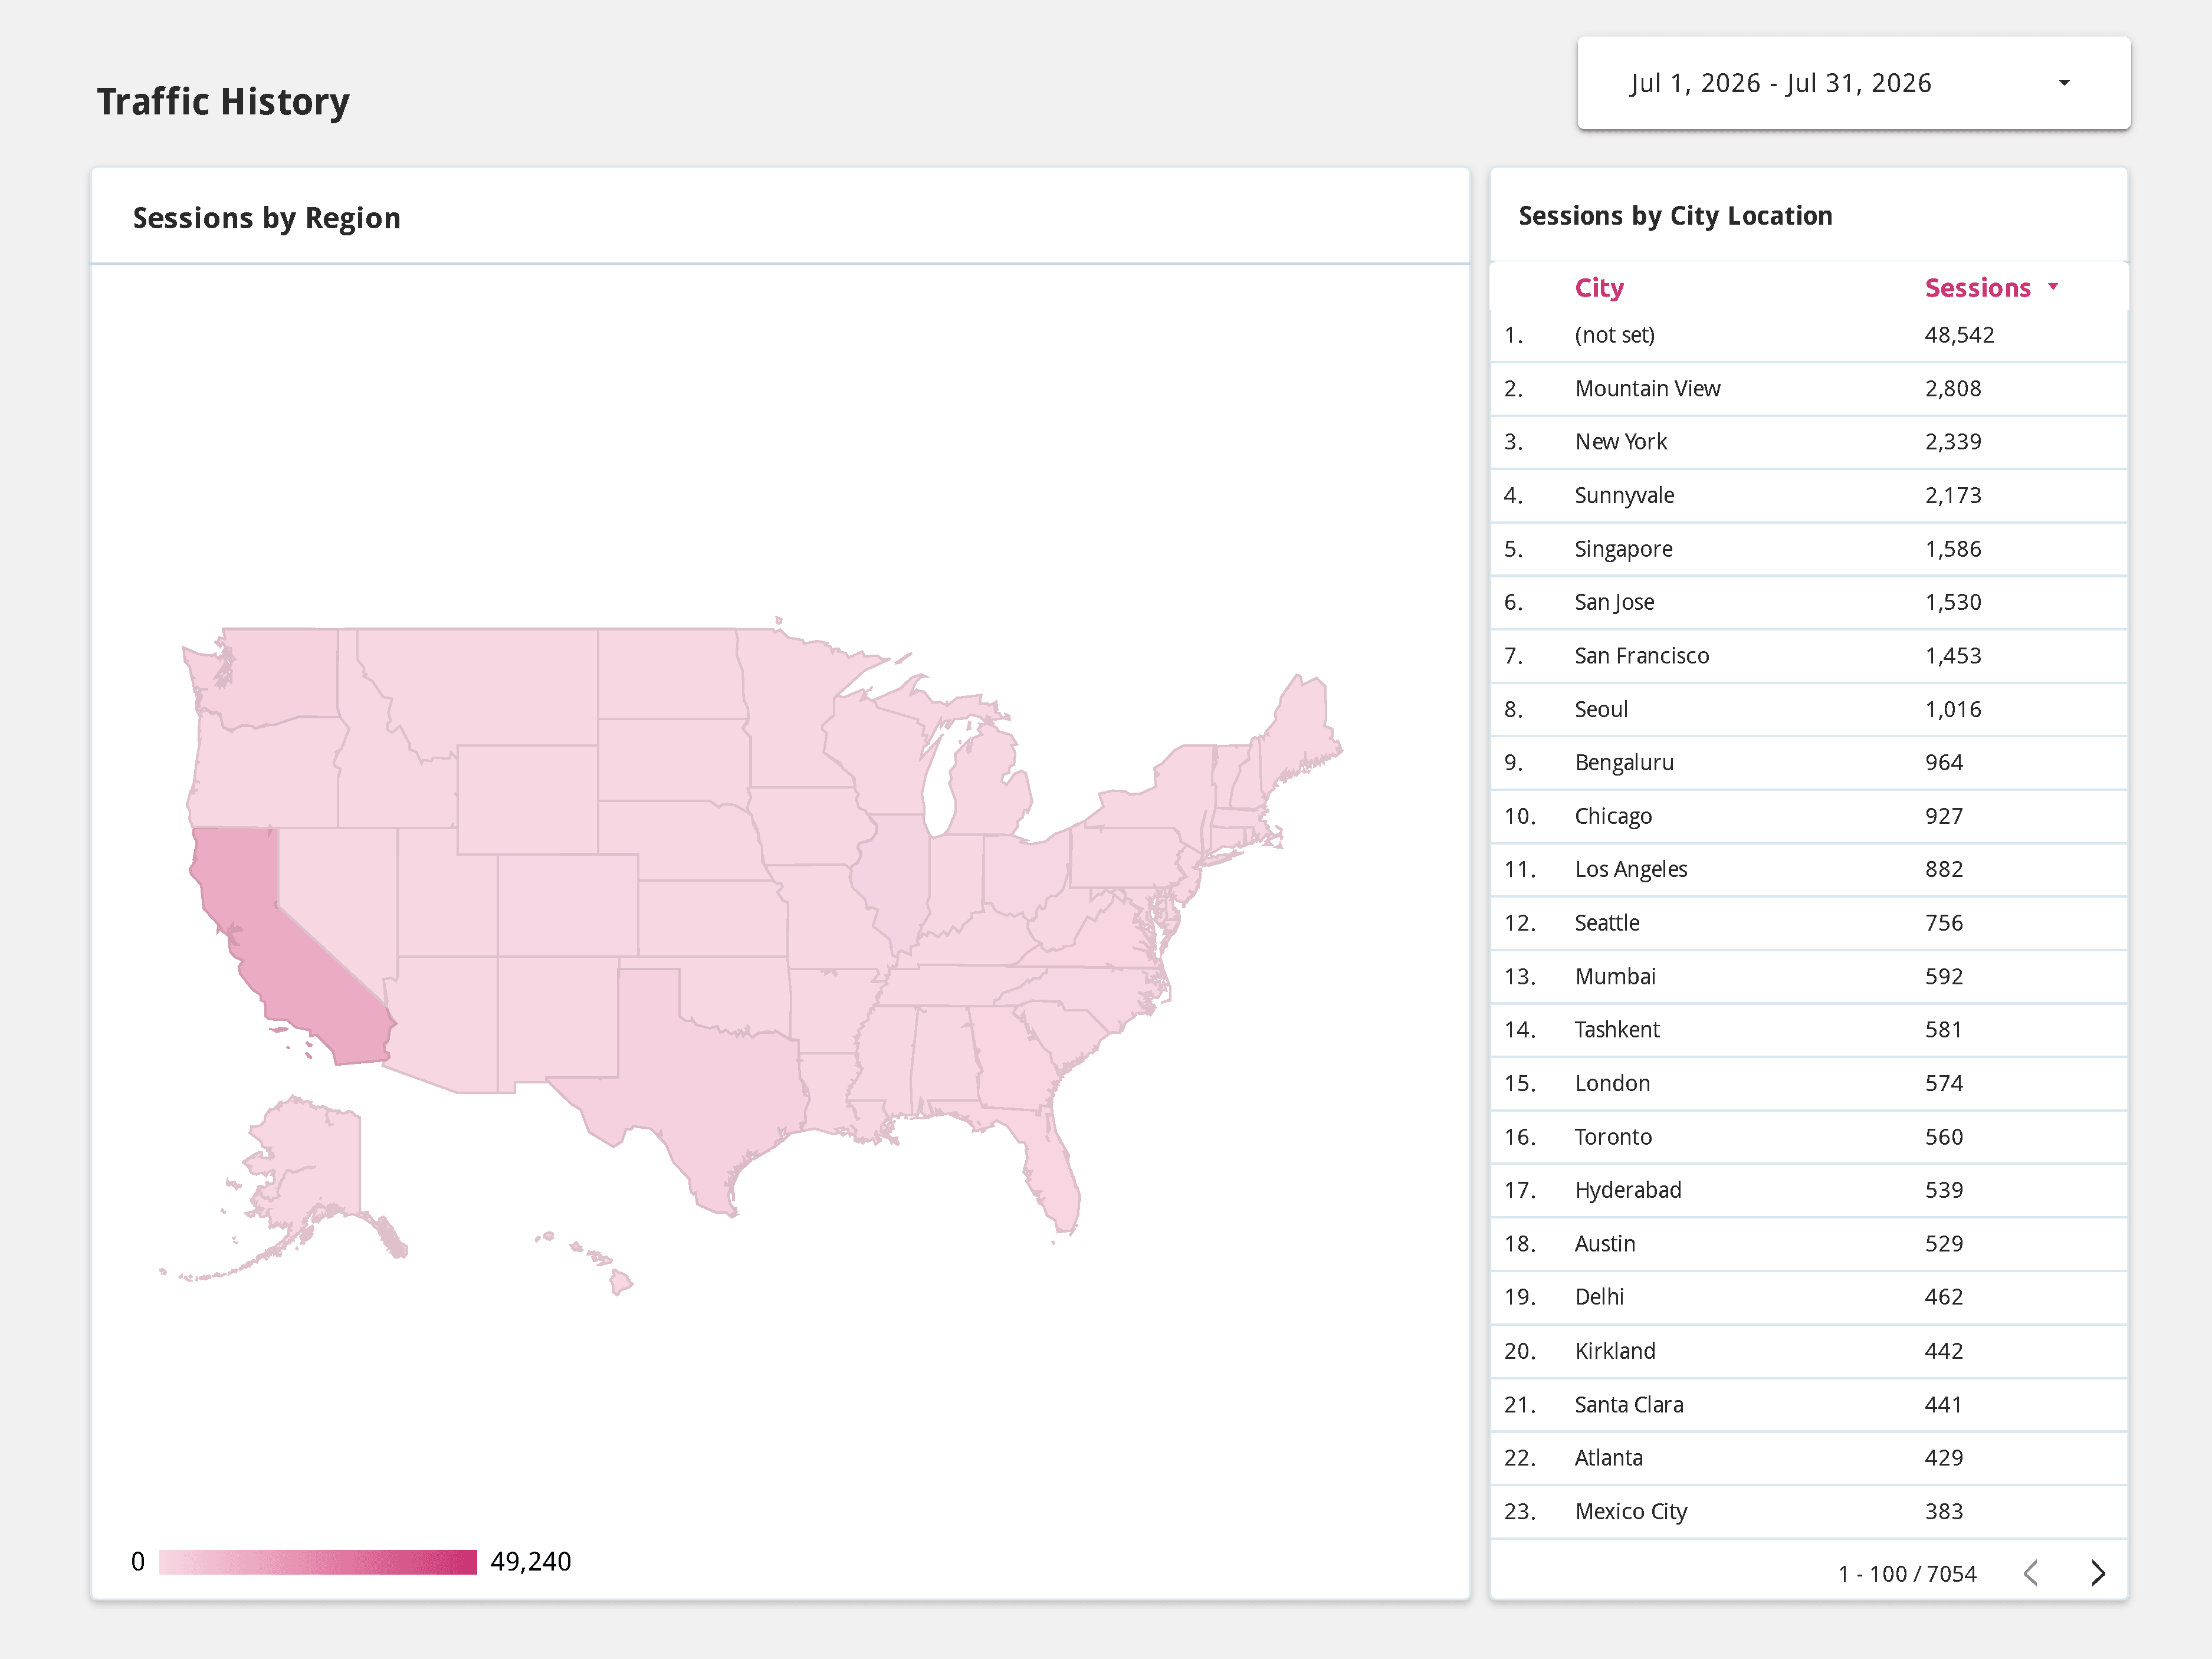
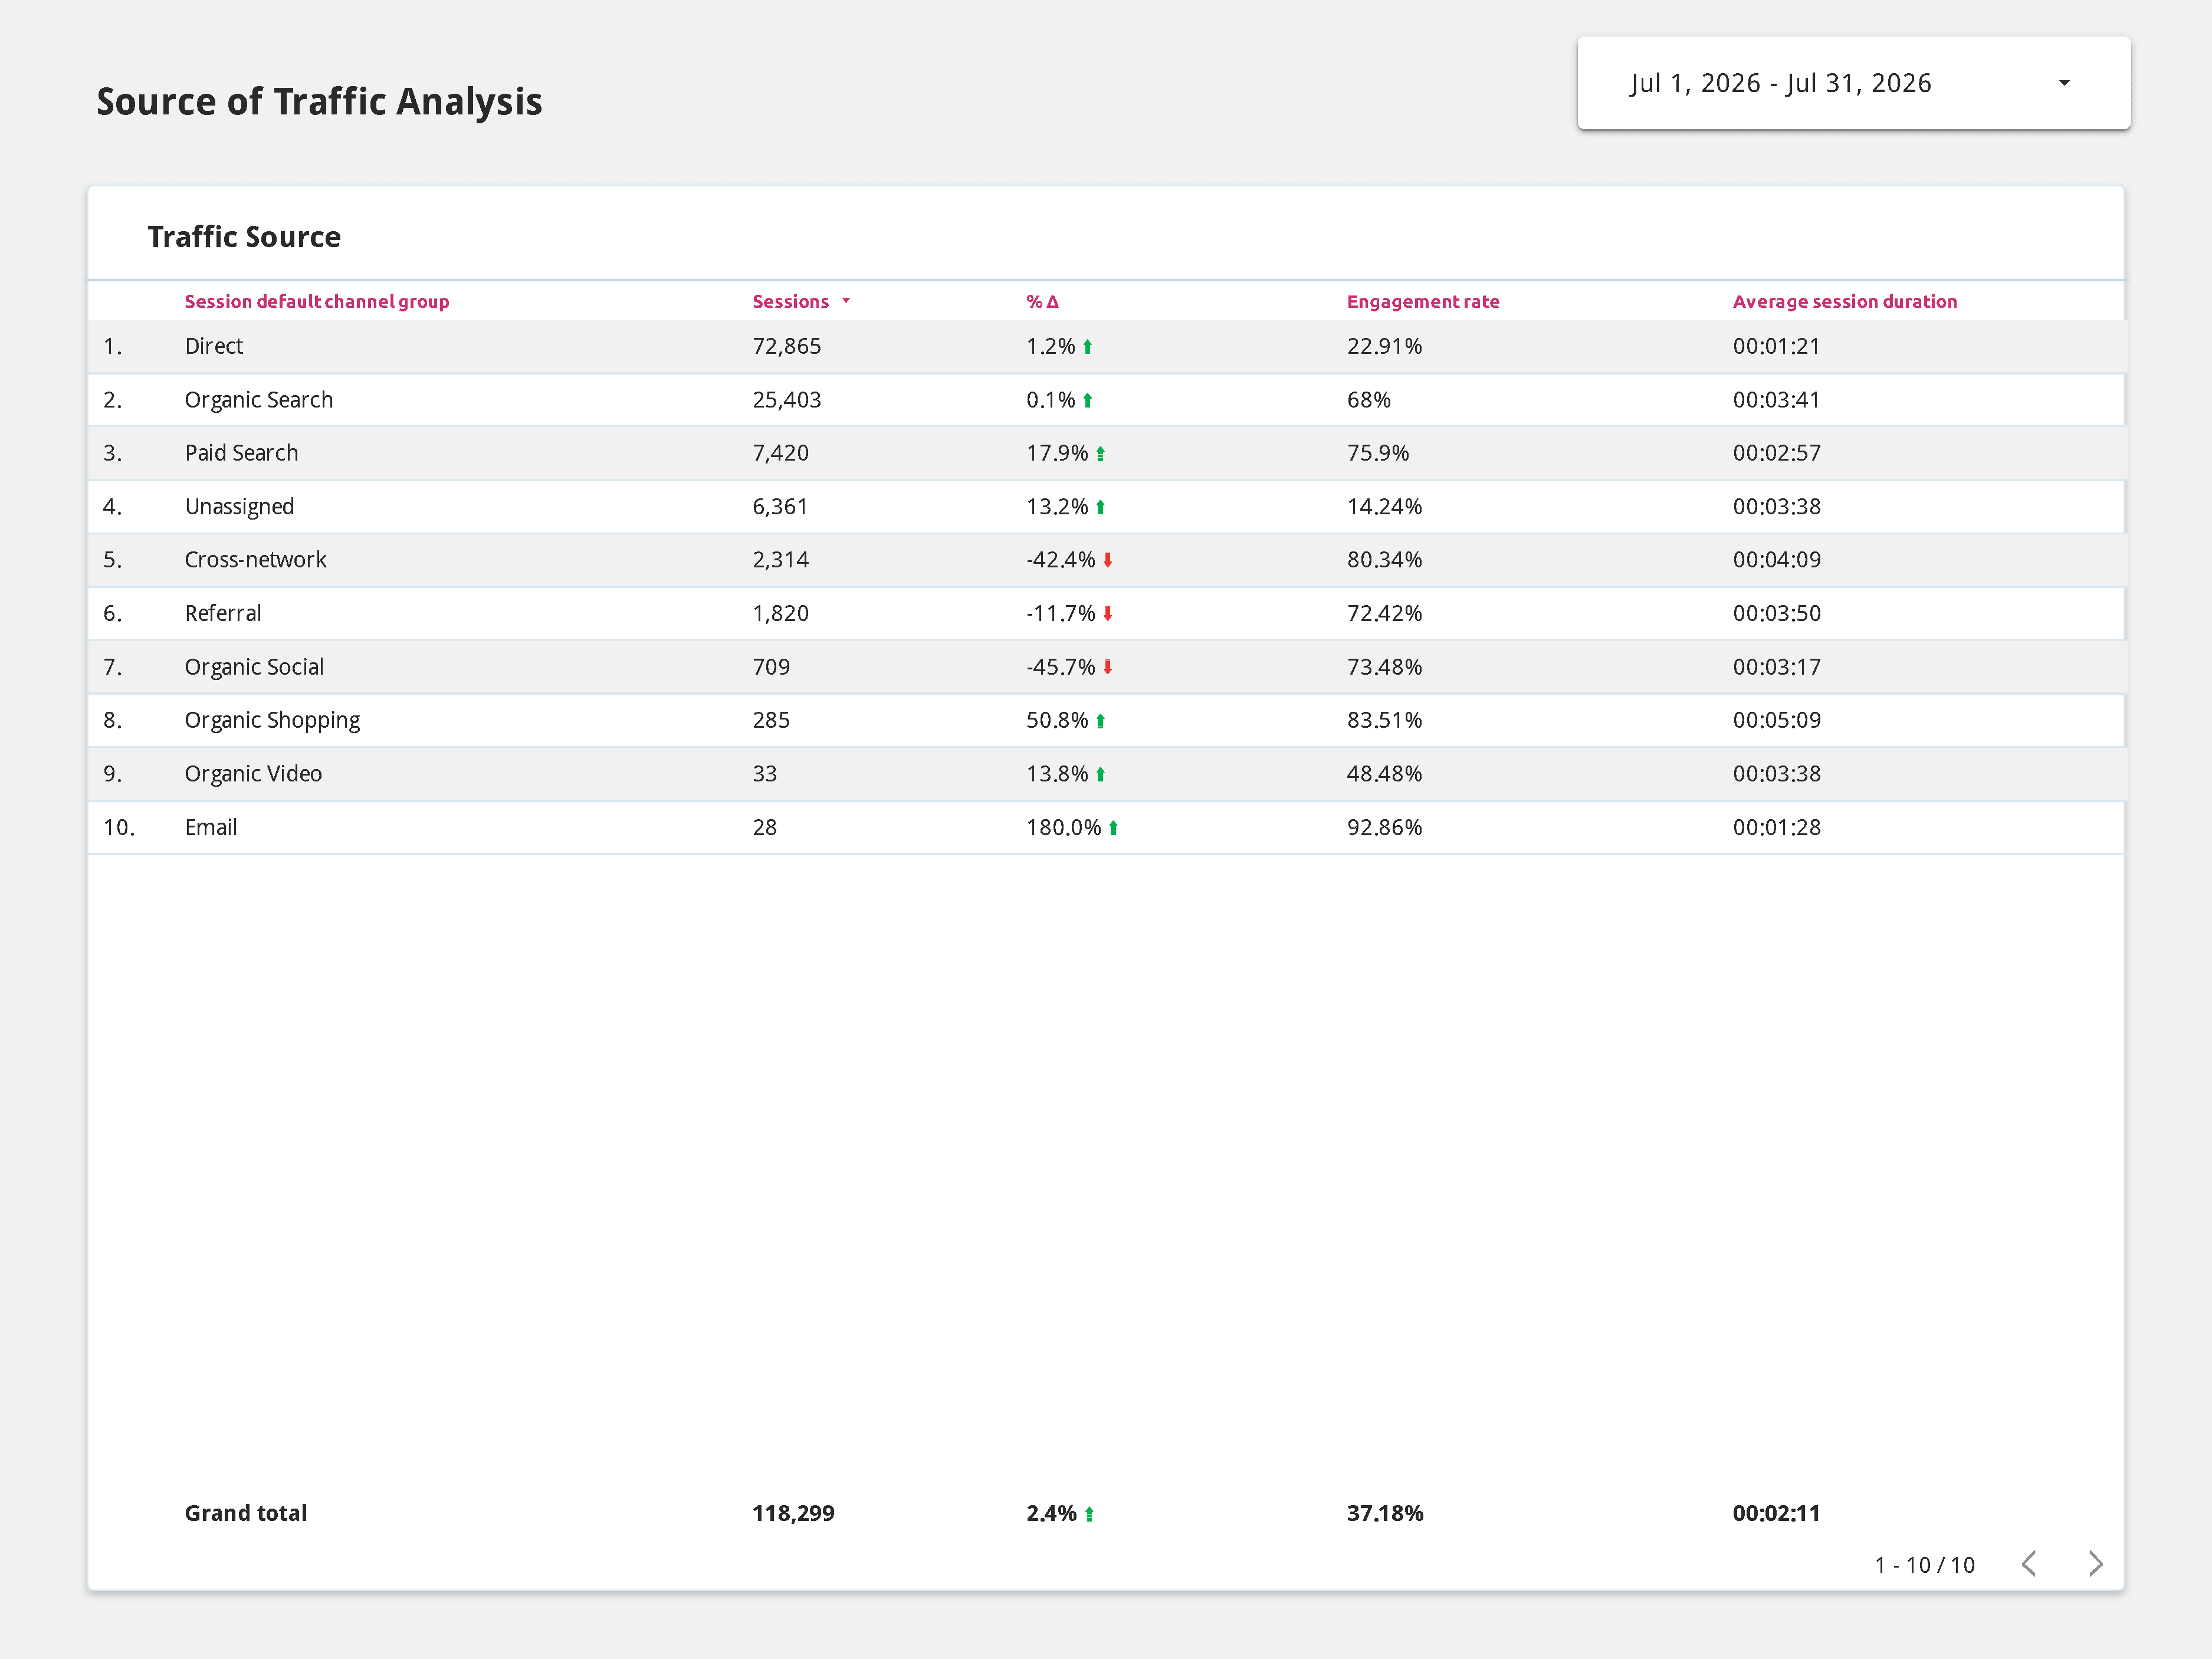
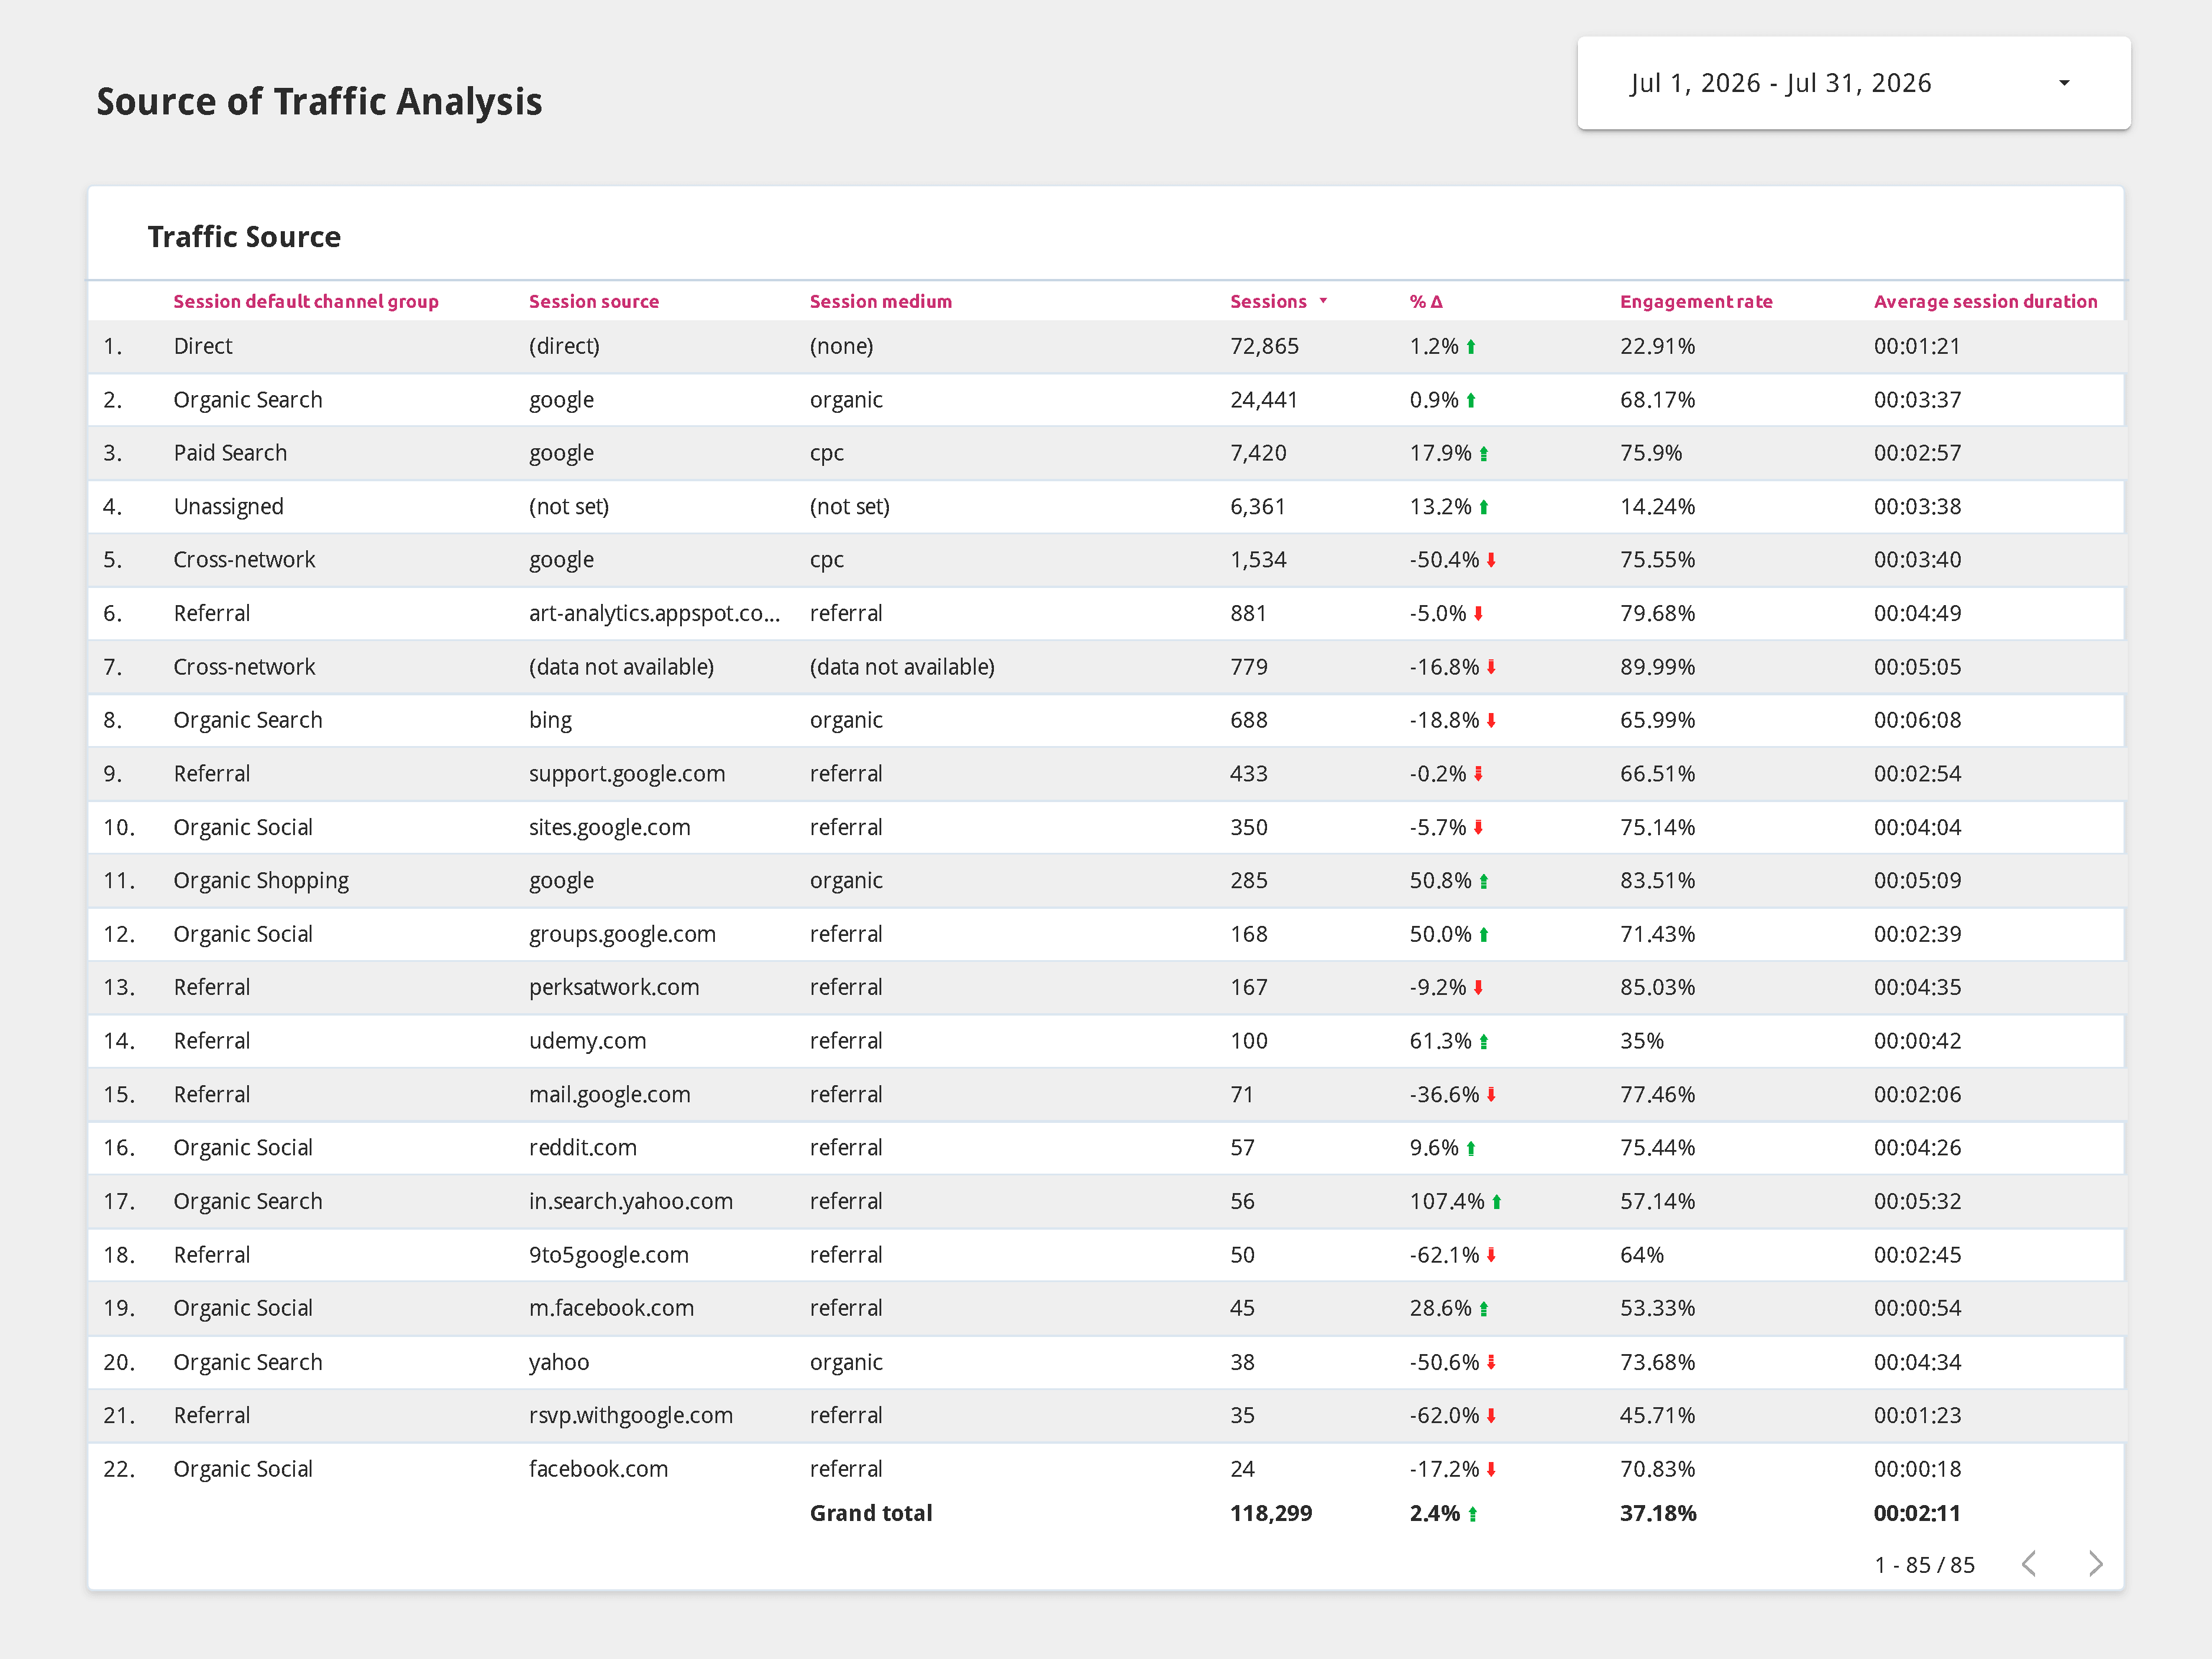
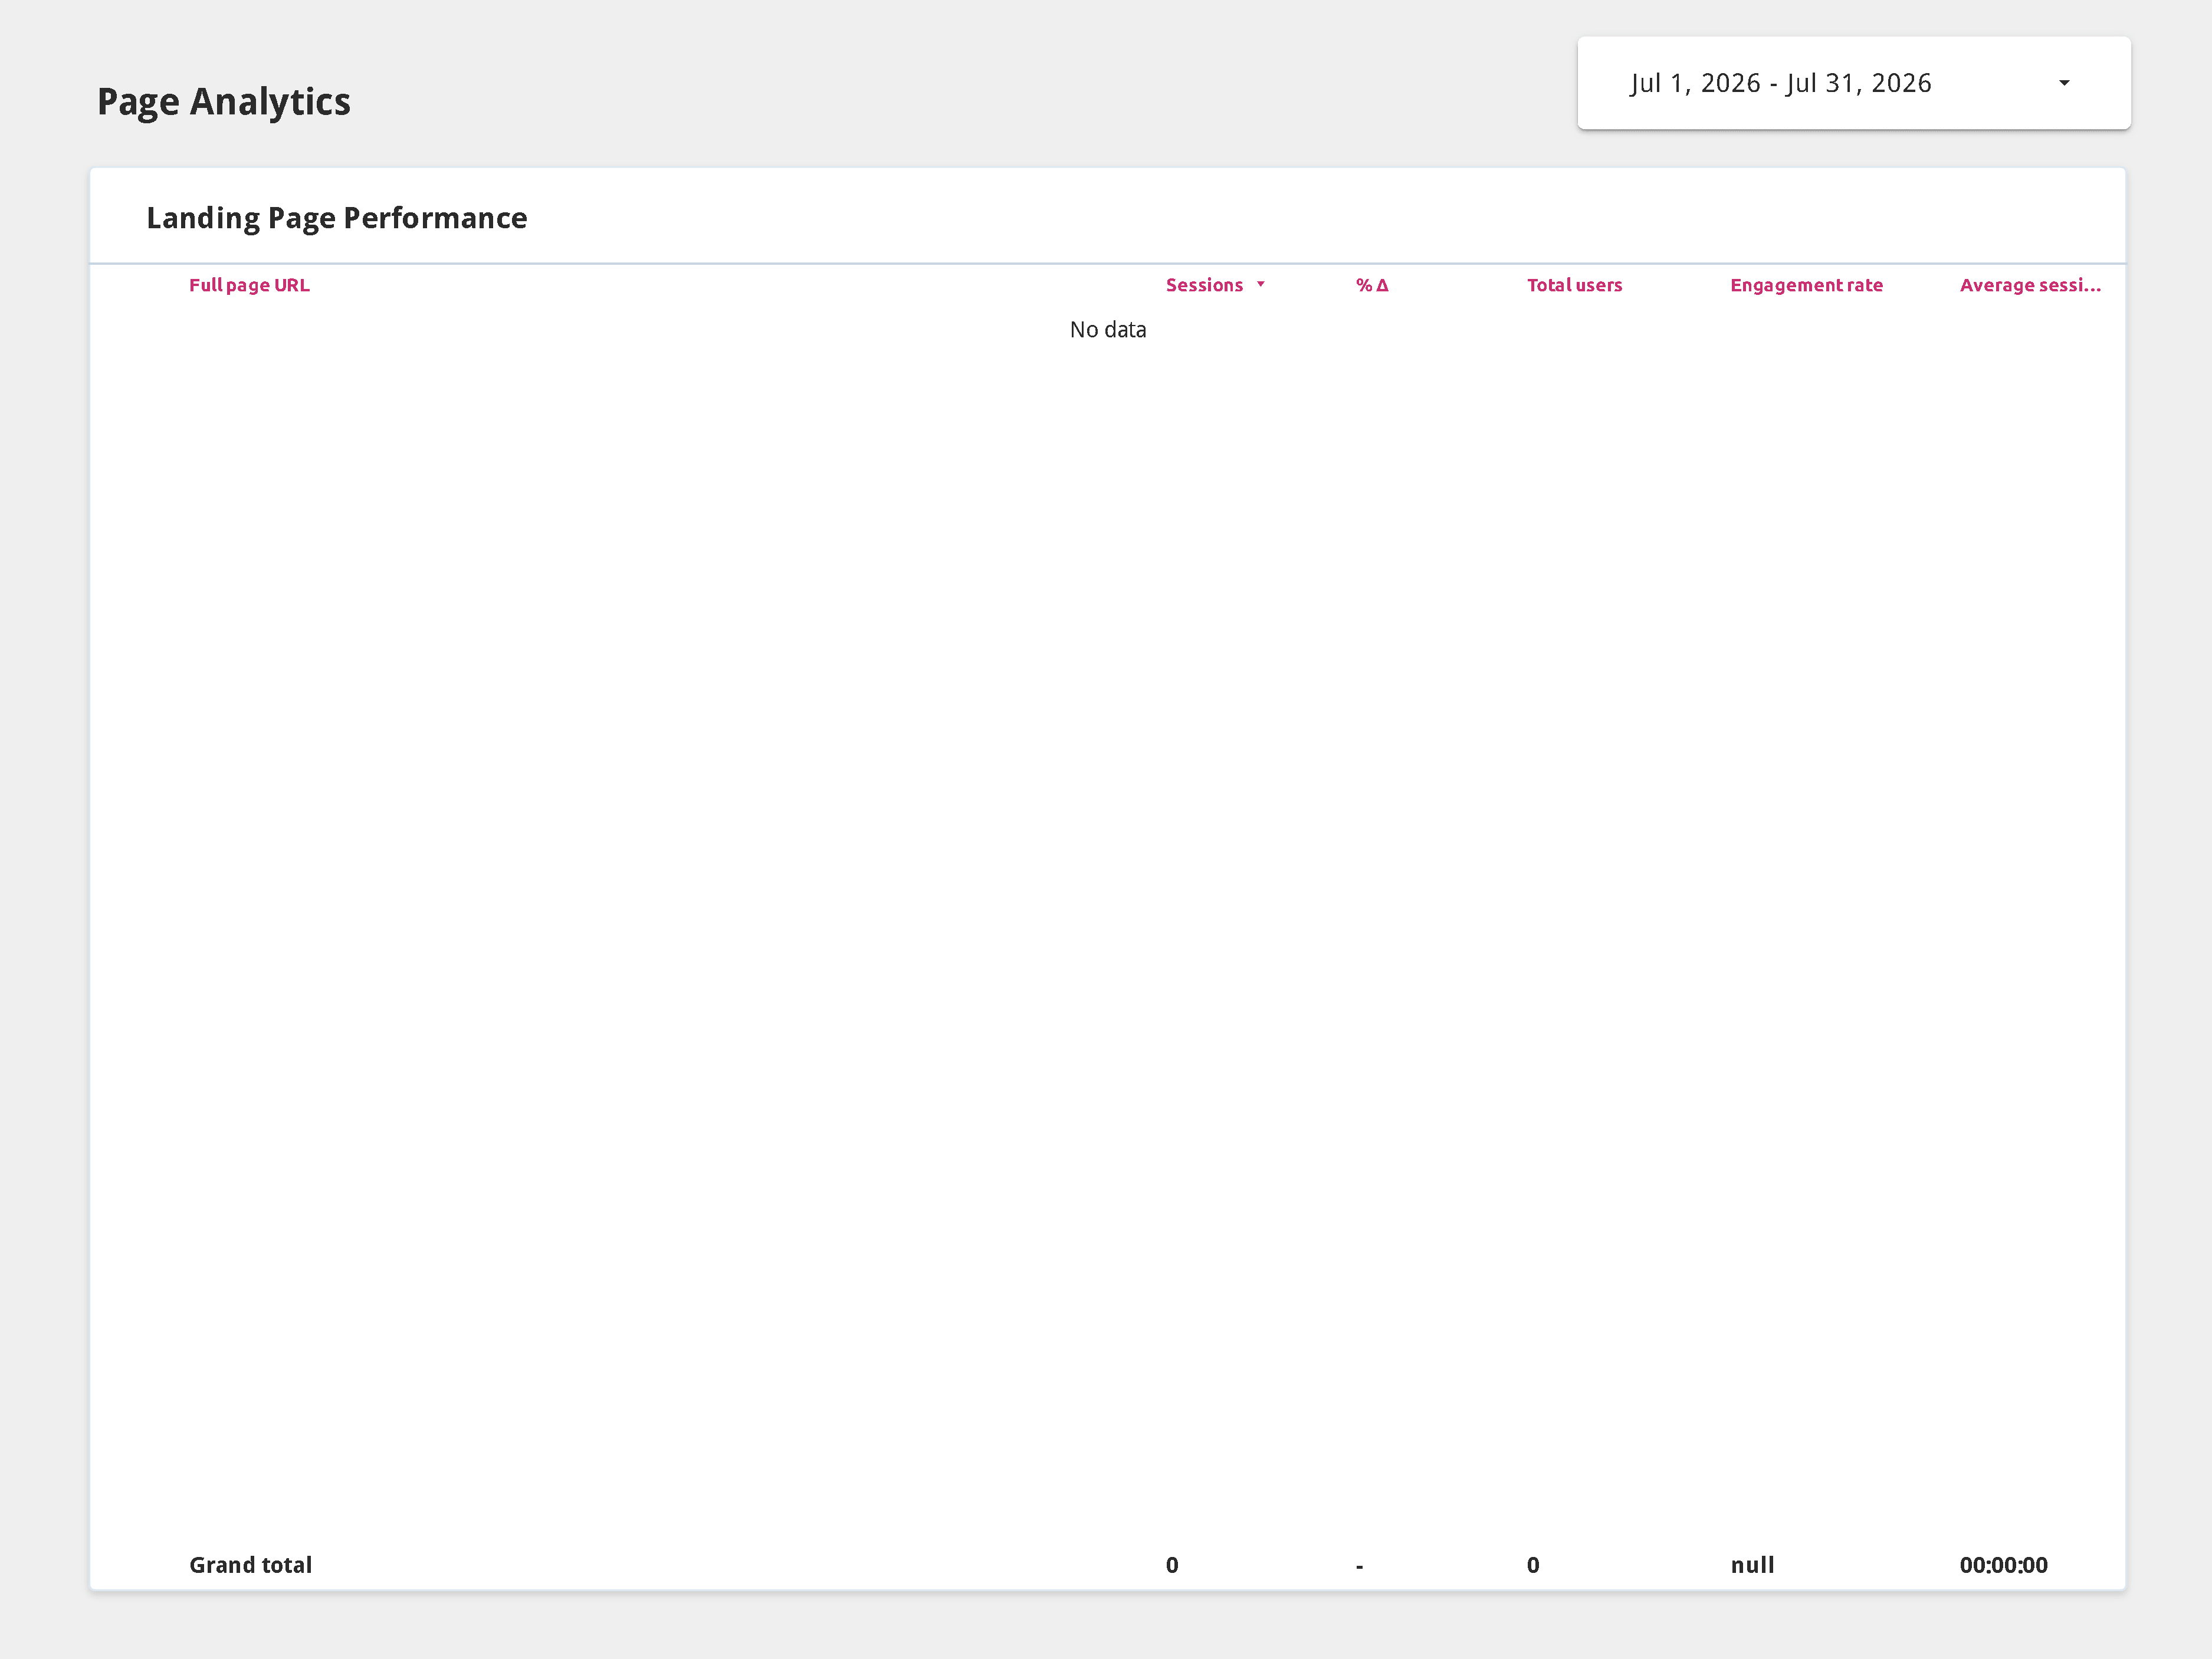
I built this Google Data Studio template to make website reporting a little more useful—and a lot less tedious. It connects to your Google Analytics 4 (GA4) data and turns it into a monthly report that helps you understand what happened and where it happened, so you stay informed and make data-driven decisions.
The report covers questions like:
- Which channels are bringing in the most traffic?
- Why did traffic increase or drop?
- How much of your traffic is new vs. returning?
- Which pages and blog posts are getting the most attention?
- Which marketing channels are bringing in the best traffic?
The report updates automatically, so once it's set up, there's very little to do each month.
What You'll Need
Before you get started, you'll need two things:
- Google Analytics 4 (GA4) installed on your website
- Google Data Studio to connect your data and use the report
That's it.
Google Analytics 4
Your website needs to have GA4 installed and collecting data. Ideally, you'll have at least a couple of months of data to work with so the report has something useful to tell you.
If you're setting up GA4 for the first time, you'll need to do that before connecting this template.
Get started with Google Analytics 4 here.
Google Data Studio
Google Data Studio is Google's free data visualization and reporting platform. It connects to data sources like GA4 and turns them into interactive reports and dashboards.
You'll need a Google account with access to the GA4 property you want to connect.
Get started with Google Data Studio here.
How to Set Up the Report
Once GA4 is installed and you have access to Data Studio, you're ready to go.
1. Connect Google Analytics
First, connect your GA4 property to Data Studio.
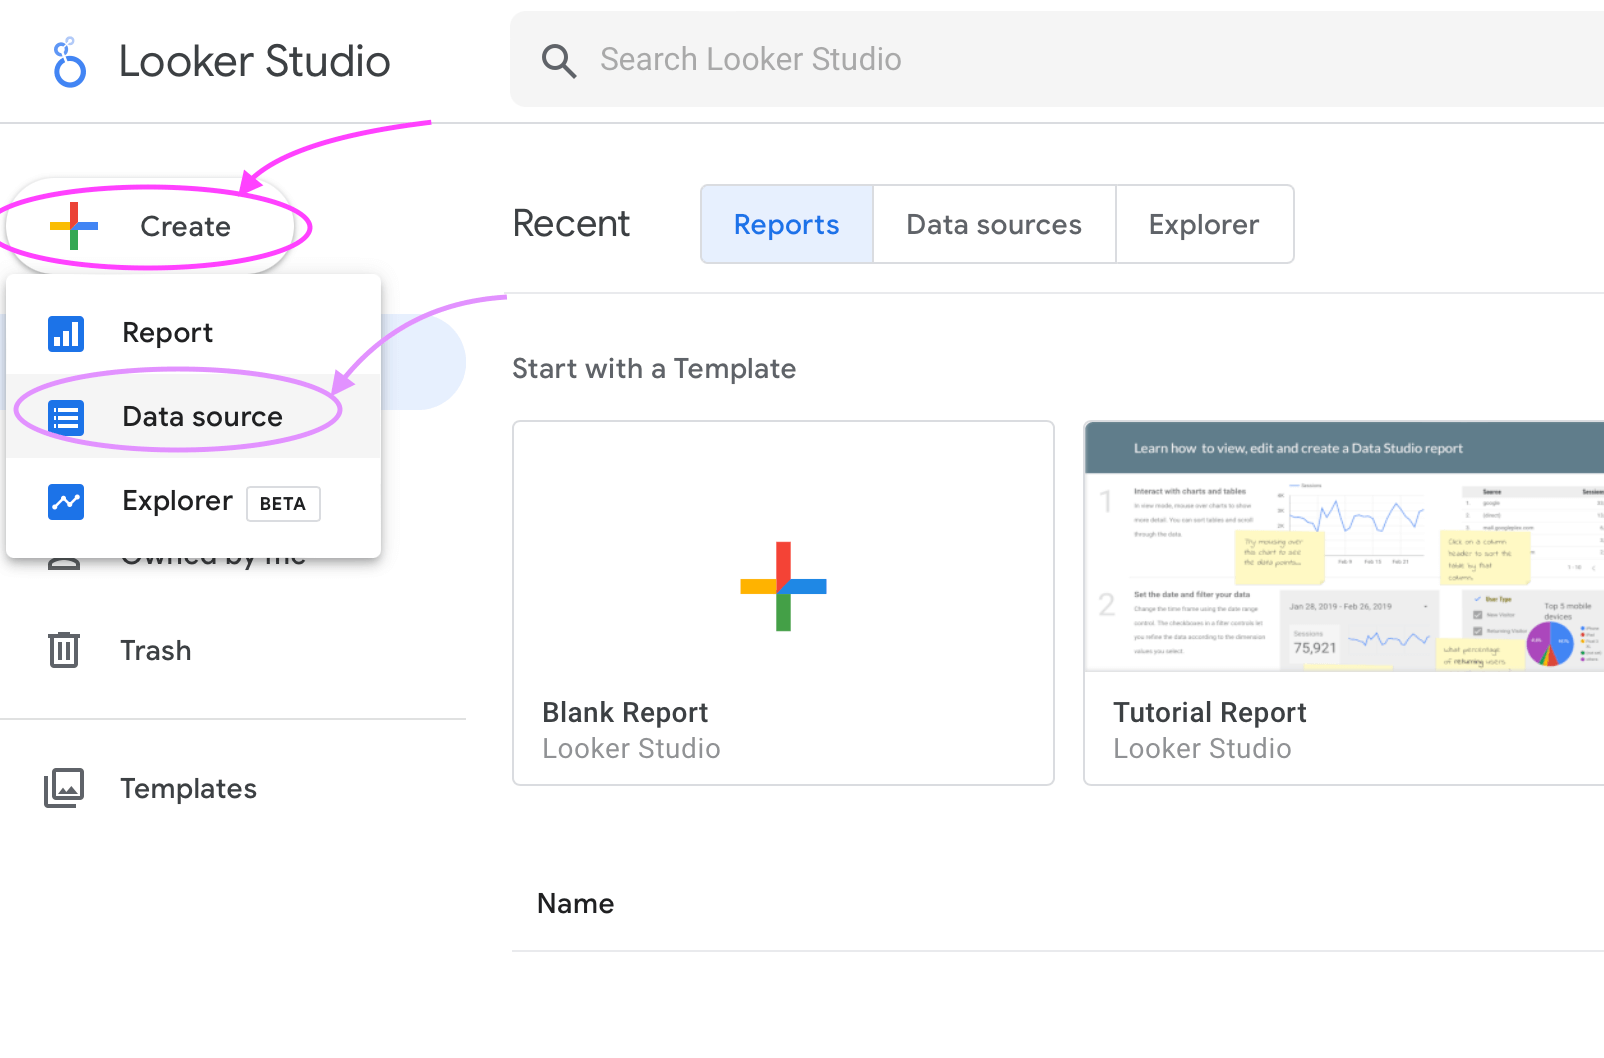
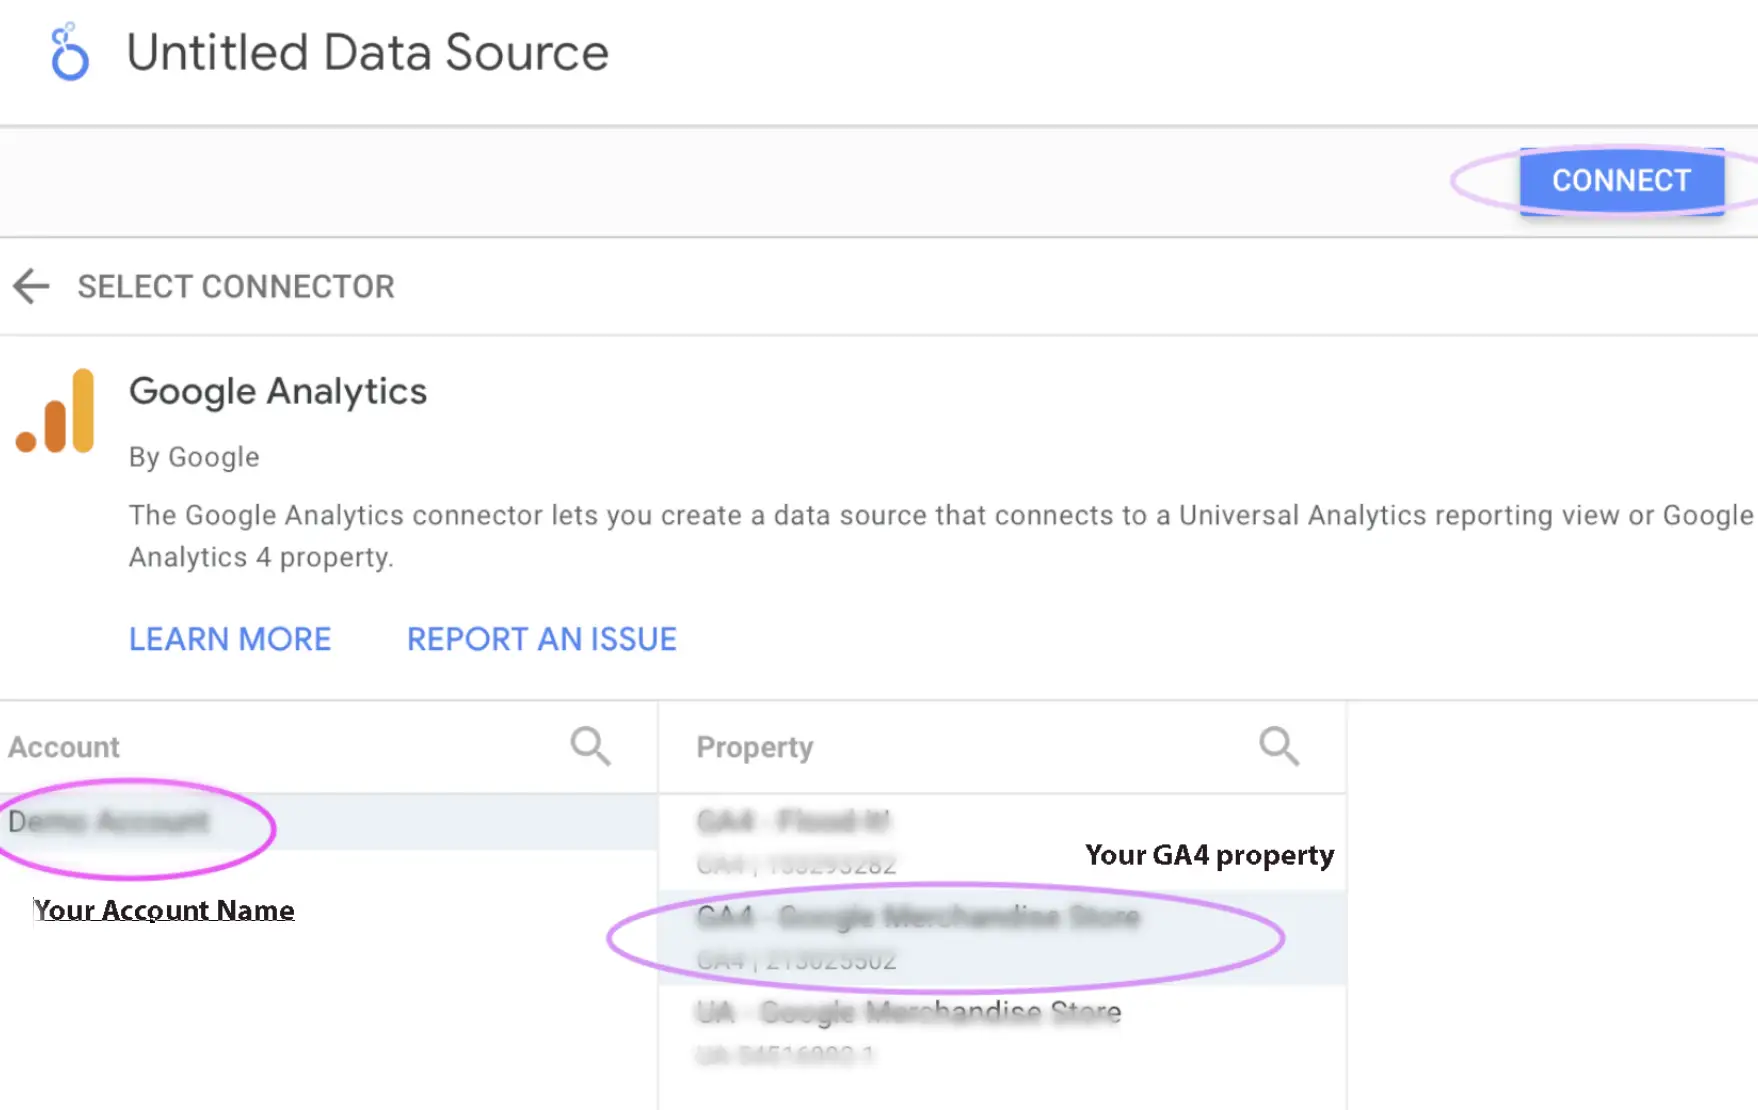
Step 1: From the Data Studio home screen, select Create → Data source.
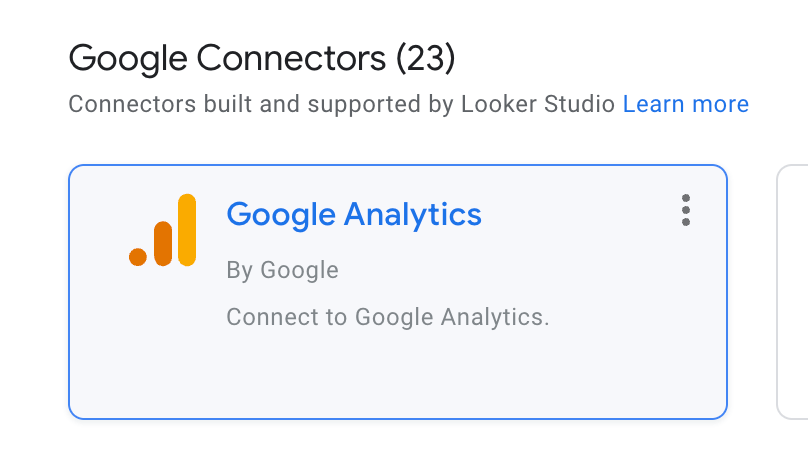
Step 2: Select Google Analytics.
Step 3: Select the Google Analytics account and property you want to use.
Choose the GA4 property connected to your website.
Step 4: Once your data source is connected, click the Data Studio logo to return to the home screen.
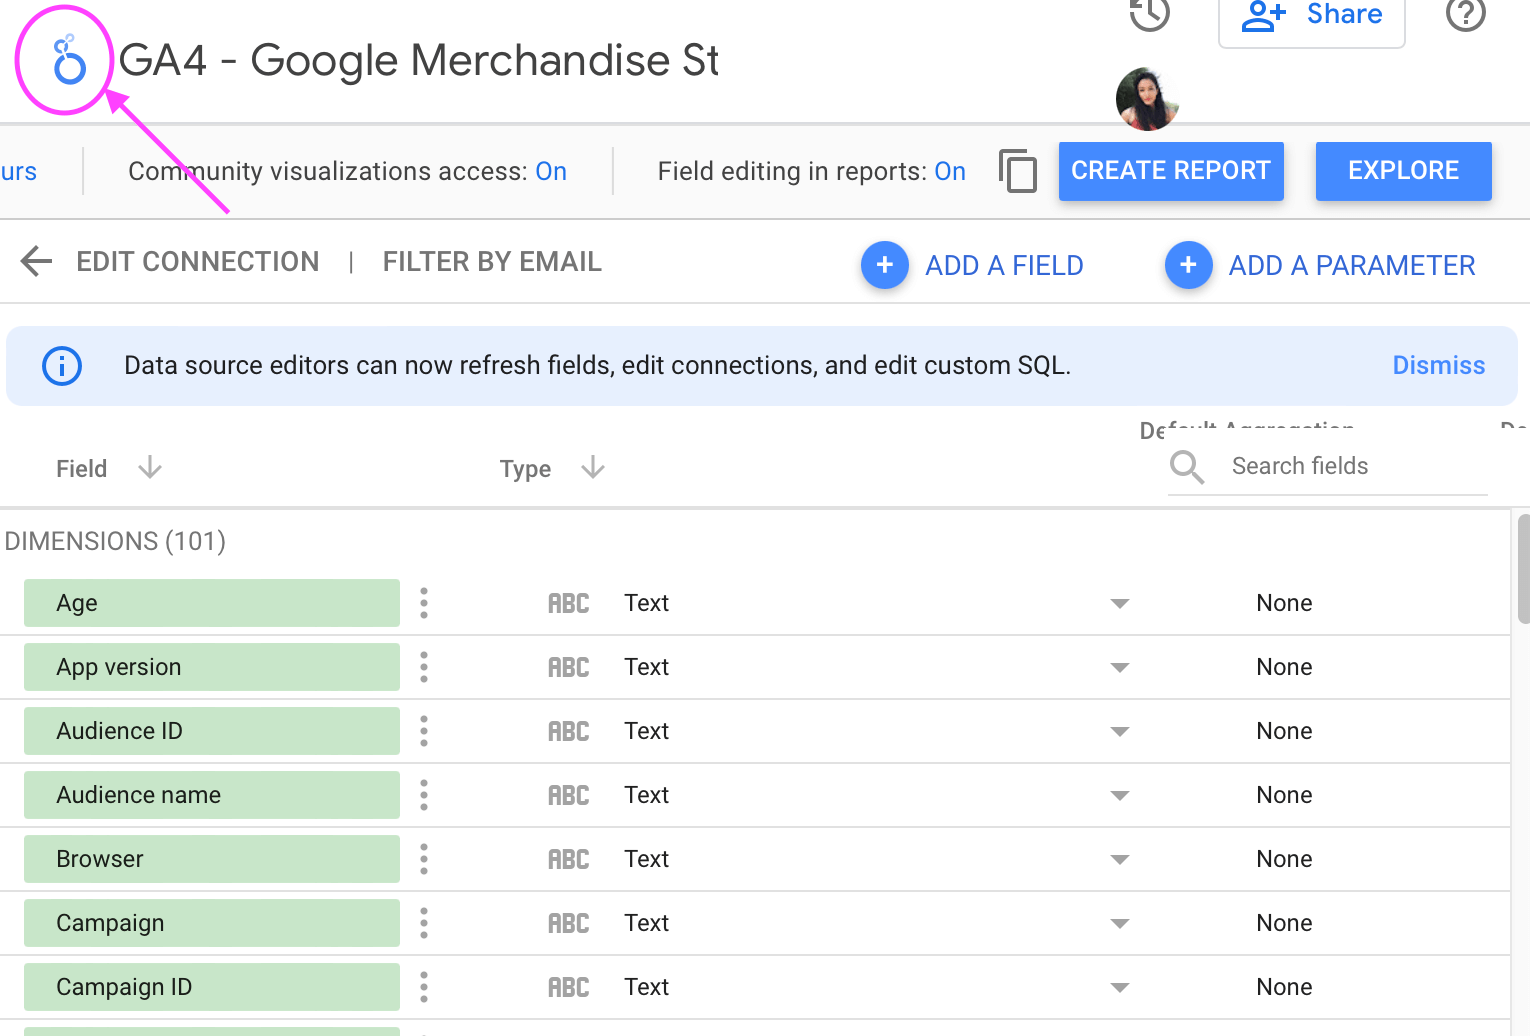
That's the hard part. You're ready to copy the report.
2. Copy the Report
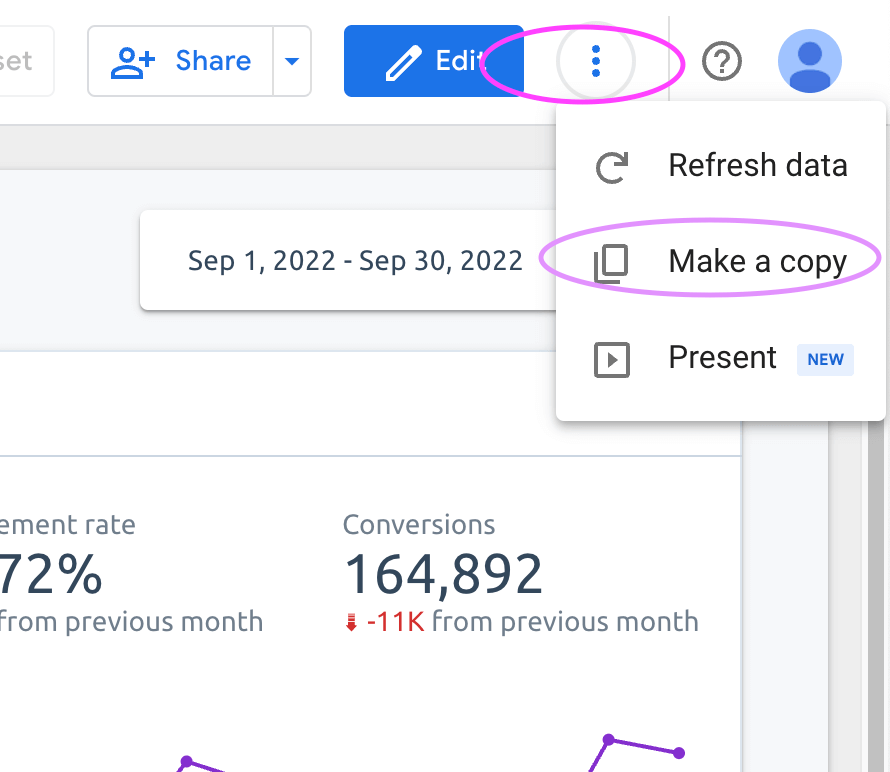
Open the template and make your own copy.
Step 1: Click the three-dot menu in the upper-right corner and select Make a copy.
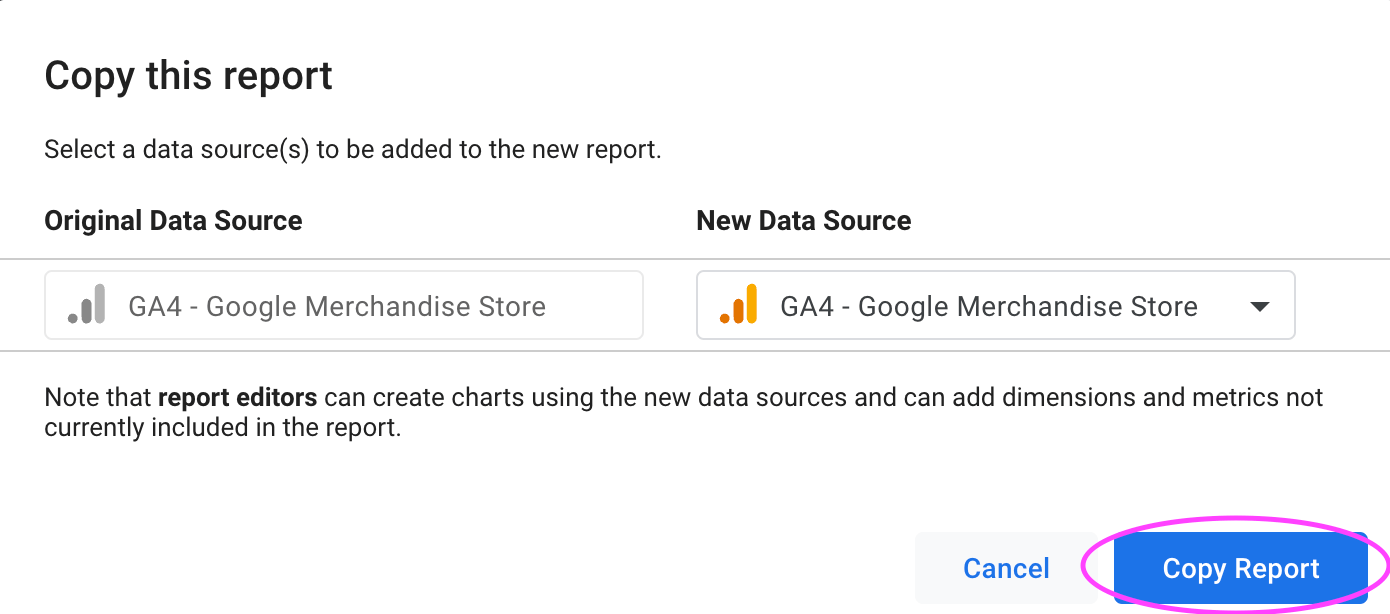
Step 2: Select the GA4 data source you connected in the previous step.
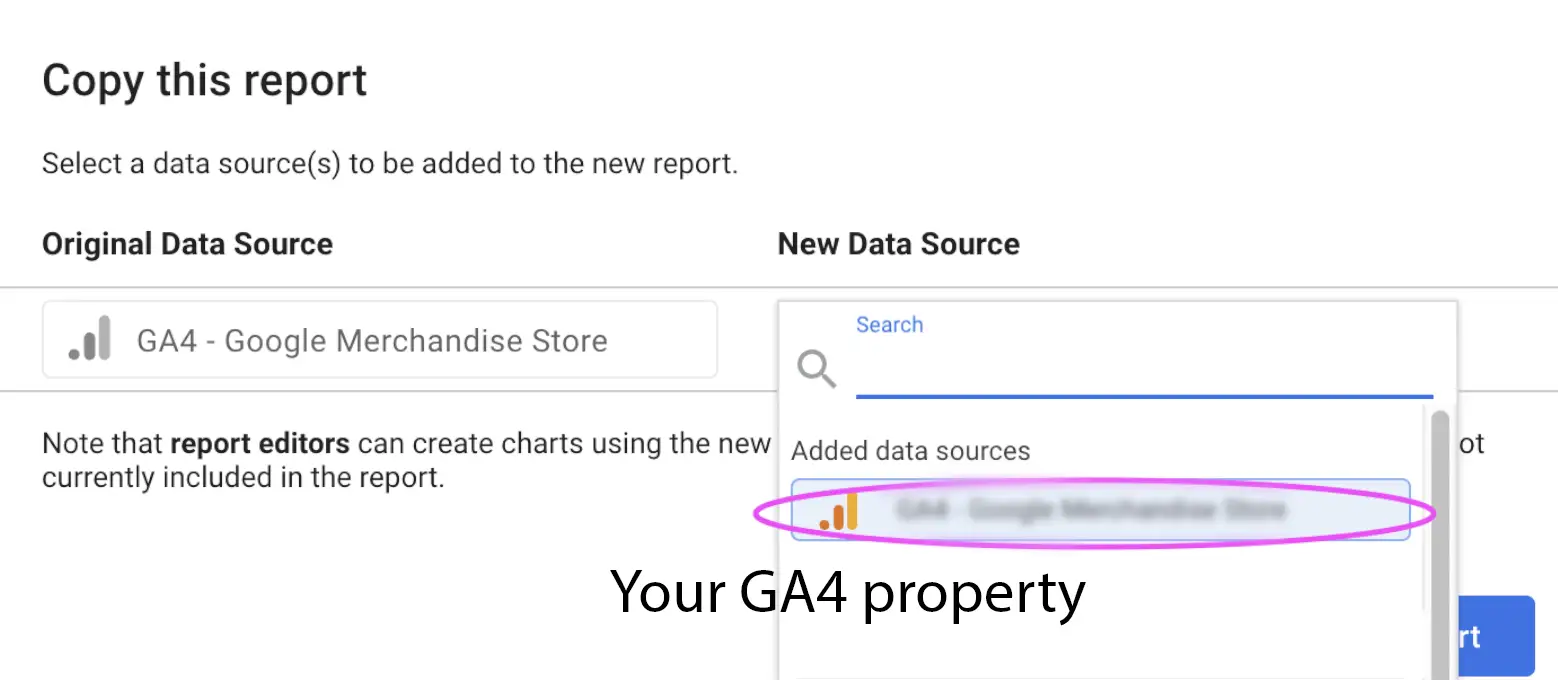
Step 3: Click Copy Report.
That's it. You now have your own copy of the report.
3. Customize the Look
Want to make the report match your brand? Easy.
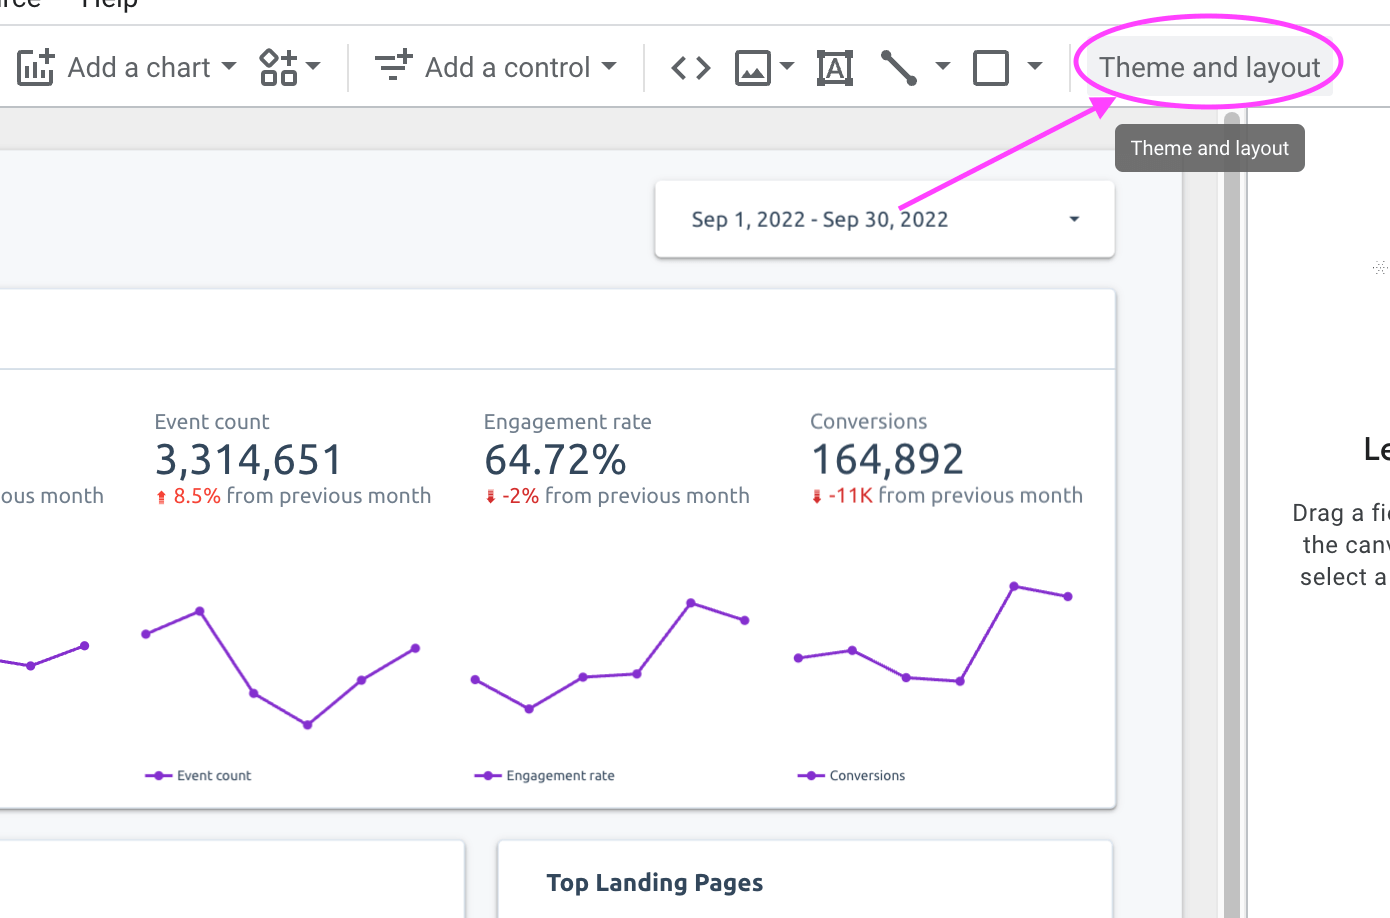
Step 1: Select Theme and layout.
Step 2: Select Customize.
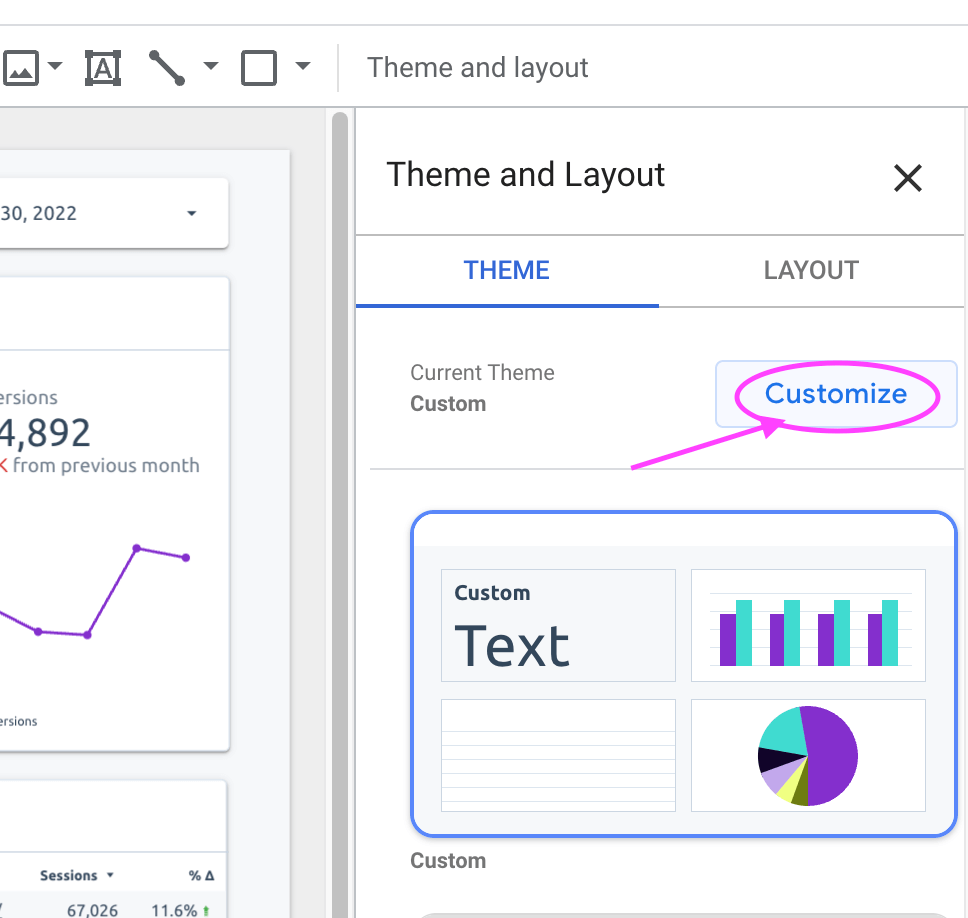
Step 3: Adjust your colors, fonts, and other theme settings, then save your changes.
Now it looks like yours.
Once It's Set Up, You're Done
The report pulls in your GA4 data automatically, so there's no need to rebuild the thing every month.
Use it to review your website performance, spot changes in traffic, identify your strongest channels and content, and—most importantly—start asking better questions about why the numbers look the way they do.
Because a traffic report that tells you what happened is useful.
A report that helps you figure out why it happened is considerably more useful.